
Refrigerant leak detection case study, supermarket distribution warehouse
A hidden refrigerant leak, found after three years of top-ups.
Every service call fixed a small leak, but the rack kept losing charge. KalderIQ kept pointing back to it until a deeper investigation found the real source.
Download the two-page study (PDF)from go-live to KalderIQ flagging the loss
of recurring top-ups before the source was found
estimated refrigerant and service spend on this one rack
recurring top-ups after the hidden leak was repaired
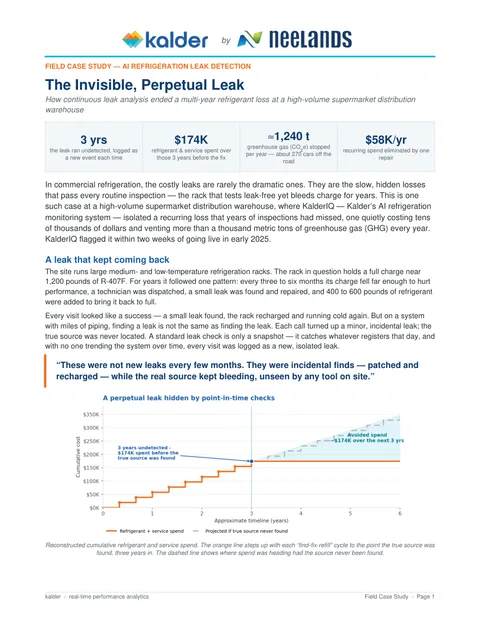
Every top-up looked like a fix. The spend kept climbing.
 The two-page field studyDownload the PDFKalder by
The problem.
A rack holding about 1,200 lb of R-407F needed 400 to 600 lb top-ups roughly three times a year. Each visit found and repaired a small leak, but the loss continued. No single service call showed the pattern. At that rate the rack was adding around 1,500 lb a year, the same as 125% of its charge, which is EPA’s chronic-leak reporting line for HFC systems since 2026.
What happened.
- KalderIQ flags the loss. Within two weeks of going live in early 2025, KalderIQ flagged an active loss while the rack was still well charged.
- The trend survives two repairs. Technicians repaired leaks twice more, and the data showed the loss continuing both times. A third finding prompted a deeper leak search.
- The real source is found. The leak was on top of a cooler, hidden behind a product box. After it was repaired, the recurring top-ups stopped.
The result.
Continuous history connected what looked like separate incidents into one unresolved problem. KalderIQ supplied the signal; technicians found and fixed the leak.
How the numbers were worked out.
The spend estimate assumes 500 lb per top-up at $35 per lb, about $1,800 in recovery and labor per visit, and three events a year: $57,900, rounded to $58,000. The source doesn’t state the currency. It is prior recurring spend, not audited net savings after subscription costs. The study also estimates about 1,240 metric tons of CO₂e a year using R-407F’s global warming potential. The cost chart in the PDF is a reconstruction. Other, unrelated leaks can still occur. The customer’s name is withheld. Results are specific to this operation.
Seeing the same problem in your stores?
We’ll look at your equipment, your alarm response and what it would take to catch this earlier.